Overview
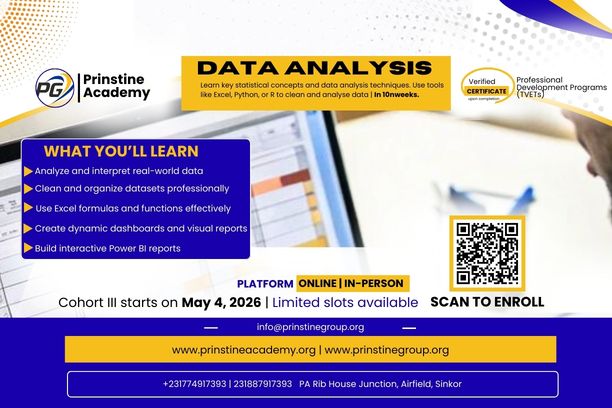
This 10-week course provides a comprehensive introduction to Data Analysis Essentials. Participants will gain hands-on skills to collect, clean, analyze, and visualize data using tools like Excel, Python, and Power BI. The course focuses on turning raw data into actionable insights, building interactive dashboards, and creating reports that drive informed decision-making. By the end, learners will be confident in interpreting data and presenting findings in a clear, professional, and impactful way.
Data Analysis Essentials
Category:
Enrollments
Level
Time to Complete:
Lessons:
Certificate:
No
One-time for 1 person
Overview
This 10-week course provides a comprehensive introduction to Data Analysis Essentials. Participants will gain hands-on skills to collect, clean, analyze, and visualize data using tools like Excel, Python, and Power BI. The course focuses on turning raw data into actionable insights, building interactive dashboards, and creating reports that drive informed decision-making. By the end, learners will be confident in interpreting data and presenting findings in a clear, professional, and impactful way.
What You’ll Learn?
Requirements
Syllabus Overview
Lessons
Quizzes
Tasks
Resources
Module 2: Excel Formulas & Functions
Module 3: Cleaning & Validating Data in Excel
Module 4: PivotTables & Dashboards in Excel
Module 5: Introduction to Python & Jupyter
Module 6: Data Cleaning in Python
Module 7: Exploring & Analyzing Data with Python
Module 8: Visualizing Data with Python
Module 9: Power BI for Interactive Dashboards
Module 10: Final Project & Presentation
Material Includes
Instructor(s)


Learner Reviews
(Average)